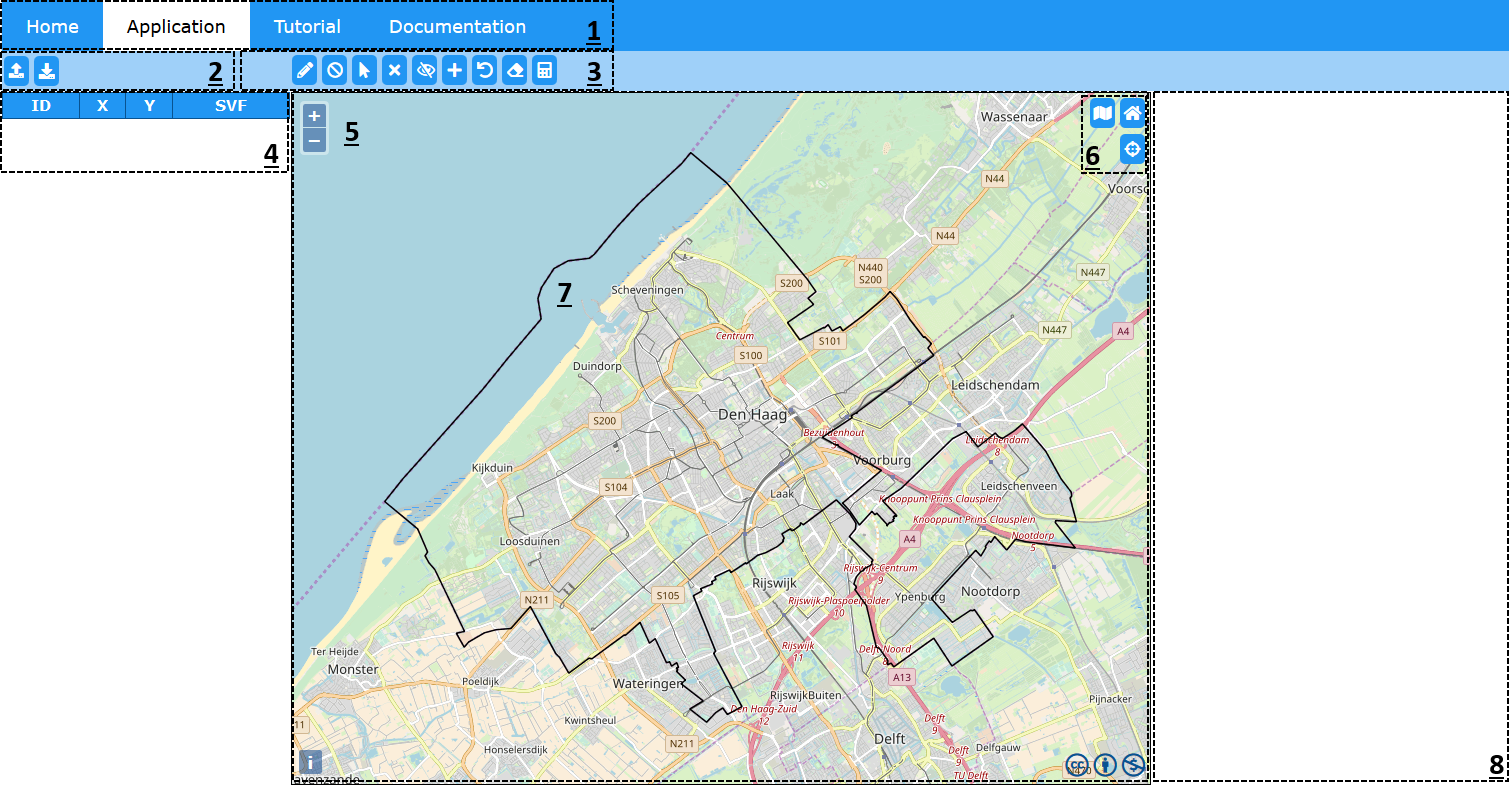
Overview
| Button | Function |
|---|---|
| Home | Navigates you to the homepage. Information about the project, the group behind this project and contact information can be found here. |
| Navigates you to the Sky View Factor application. | |
| Navigates you to the tutorial, this page. Information about how to use the web application and website in general can be found here. | |
| Navigates you to the documentation. On this page documentation can be found on the processes that are required to create this application. |
| Button | Function |
|---|---|
| Gives you the option to upload a CSV-file containing the coordinates of the points you would like to calculate the SVF value of. | |
| Lets you download a CSV-file containing the point IDs, coordinates of these points and their respective SVF values. |
 You can download an example by clicking on this link
| Button | Function |
|---|---|
| Enables the draw-points function. With this button you can draw points on the canvas, these points and their coordinates will be stored in the table on the left of the screen. | |
| Disables the draw-points function. After clicking on this button you can freely click on the map without creating unwanted points. | |
| Enables the select-points function. This button lets you select drawn points on the map. If the calculation of the SVF has been done, selecting a point on the canvas will result in the SVF-plot becoming visible on the right side of your screen. | |
| Enables the delete-point function. This button lets you delete a selected point on the map. | |
| Enables the ignore-building function. This button lets you remove a building from the SVF calculation process. This can be useful when a user desires to see the effects of e.g. demolishing a certain building has on the SVF of a given location. | |
| Enables the create-building function. This button lets you draw a building to the map canvas. After you're finished drawing a building (by connecting the end-point to the start-point of your drawing), a pop-up shows requesting the height of the building. | |
| Enables the undo-calculation function. This button lets the user clear all calculations, so that these can be done again under e.g. different cirucumstances. This can be useful in detecting differences in SVF values before and after adding or ignoring a building. | |
| Enables the clear-canvas function. This button lets the user clear everything from the canvas and the tables. It is a quick method of restarting your session. | |
| Enables the calculation function. When all inputs have been determined, this button will start the actual calculation of the SVFs and their corresponding plots. |
| Label | Description |
|---|---|
| ID | Refers to the ID of the drawn point. This starts at 1 and counts up after adding more points. |
| X | Refers to the x-coordinate of the drawn point. This is displayed in the Dutch coordinate system (CRS) "EPSG:28992". |
| Y | Refers to the y-coordinate of the drawn point. This is displayed in the Dutch coordinate system (CRS) "EPSG:28992". |
| SVF | The calculated Sky View Factor is displayed here after calculation. |
| Button | Function |
|---|---|
| Gives you the option to change the background layer. The default background layer is the Open Streetmap baselayer. The alternative background layer is an aerial imagery map from PDOK. | |
| Gives you the option to turn the footprints layer from PDOK on or off. For the aerial imagery background this might prove useful, as the footprints can misalign with the imagery. | |
| Gives you the option to turn off the zoom on selection option. When this setting is active, you automatically zoom to a point when you select it in the table. If the button is fully visible, this setting is active. When it is inactive, the button becomes transparent. |